GOAL
After writing a simple firmware sample with a buffer overflow vulnerability, debug a crashing input from Fuzzware to determine the exact cause of the crash. Utilize tools provided by Fuzzware to patch the input and explore the potential for execution flow control.
BACKGROUND
Fuzzware is a “project for automated, self-configuring fuzzing of firmware images”. Rather than emulating entire device peripherals, it fuzzes the MMIO memory ranges of ARM firmware. When a peripheral and a firmware image want to communicate, device registers are mapped into the address space of the processor, allowing the two devices to communicate by reading and writing – using standard memory operations – to this address space. Therefore, Fuzzware can fuzz peripheral input without having to emulate the peripheral itself. Fuzzware utilizes Unicorn to emulate the firmware and AFL/AFL++ to provide the fuzzing input. It includes functionality to triage and debug crashes, generate coverage statistics, and replay patched input for analysis.
The vulnerable firmware that was tested has the following source code:
stack_overflow.ino
void setup() {
    Serial.begin(9600);
}

void loop() {
    int i = 0;
    volatile char buffer[5]; // the 'volatile' keyword prevents compiler optimizations
    while (i <= 100) {
        if(Serial.available()) {
            buffer[i] = Serial.read();
            i++;
        }
    }
    return;
}
The loop function insecurely writes data to the buffer without checking the buffer’s size. Therefore, inputting more than 5 bytes of data on the serial UART port will result in a buffer overflow. The sample firmware was compiled with the Arduino IDE for the Arduino Zero.
TOOLS
To fuzz the firmware and triage the crashing input, I utilized:
-
Arduino IDE to compile the sample binary for the Arduino Zero
-
Fuzzware’s ‘pipeline’ tool to fuzz the MMIO address space of the binary
-
Fuzzware’s ‘replay’ tool to determine exact functions and basic blocks where the crashes occurred.
-
Ghidra to analyze decompiled source code and determine variable/function memory addresses
-
xxd to patch the input binary
CRASH INVESTIGATION
After fuzzing the vulnerable firmware with Fuzzware’s ‘pipeline’ utility, we are given many
crashing inputs. It can be useful to sort these inputs by size (smallest to largest) to determine the
fastest path to a crash for debugging purposes.
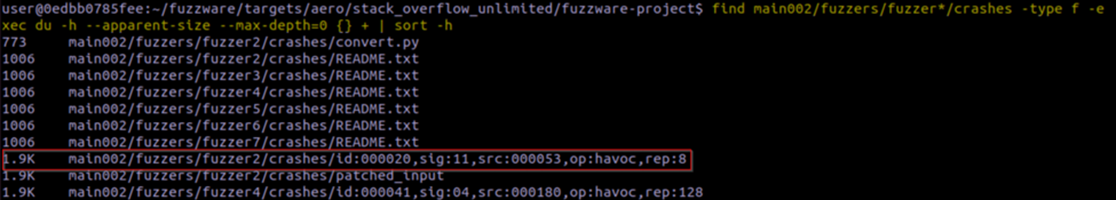
As we can see, the 20th crash in fuzzer 2 had the smallest crashing input.
The first step is to determine where and why the crash is occurring. This can be done by running
‘fuzzware replay’ with the -v and -t flags.
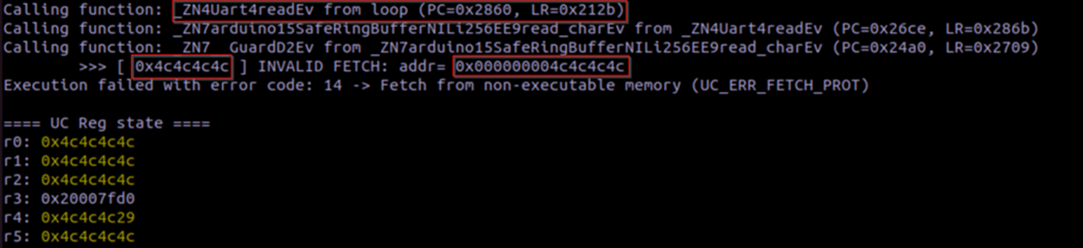
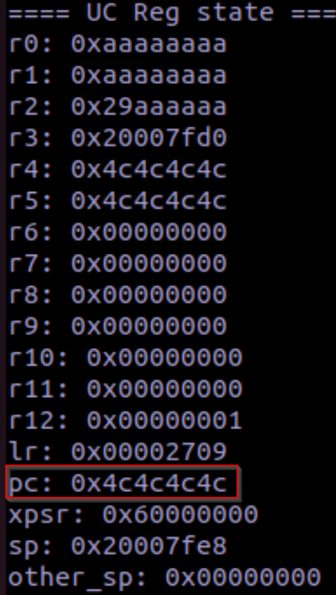
As shown above, the crash is caused by trying to fetch from non-executable memory. We are
already provided some hints – the registers are all filled with ‘4c’ (hex for L) and the invalid
address was also ‘0x4c4c4c4c’. Looking in the stack provides some further context to what is
happening:
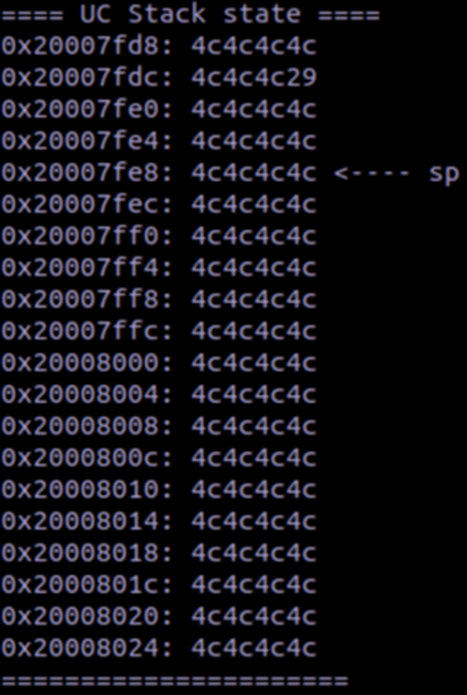
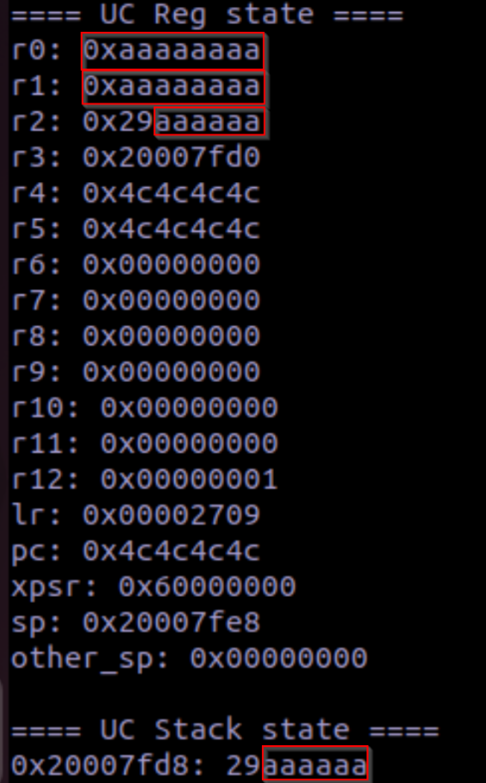
We can see that the stack is also filled with ‘4c’, showing that a stack overflow took place.
The next step to pushing the vulnerability further is to patch the input to control the data that is
entered. The Fuzzware documentation for this can be found here.
First, use Fuzzware’s emu (emulate) tool to trace all of the MMIO accesses to an output file
using
fuzzware emu -c <config file> --mmio-trace-out=<output_file> <input_file>
The should give an output file that looks like this:
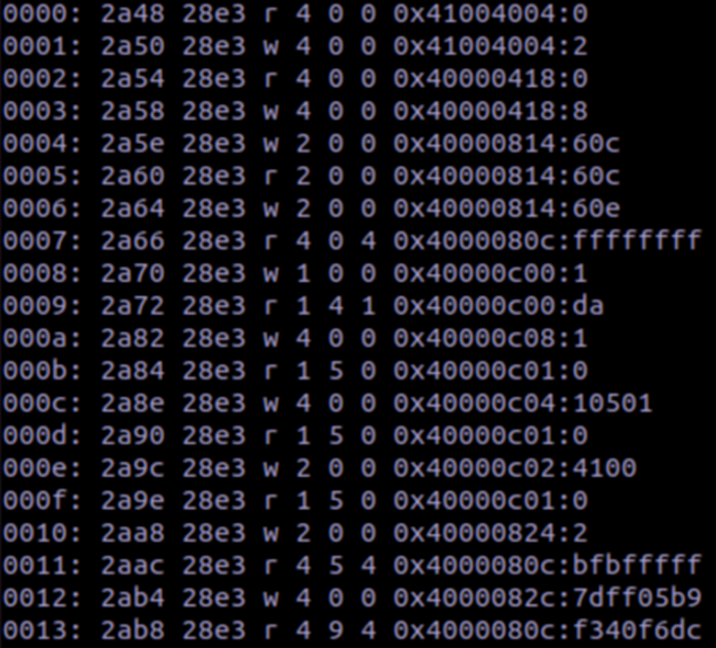
The Fuzzware documentation states that the headers for the columns, in order, are
event_id, pc, lr, mode, orig_access_size, access_fuzz_ind, num_consumed_fuzz_bytes,
address, val_text
We can narrow down the list to only the fuzz indexes of the MMIO read operations for all of the
‘4c’ characters with the following command:
cat trace.txt | grep “ r ” | grep 4c
This will return the list of all MMIO read operations where the value was 4c.
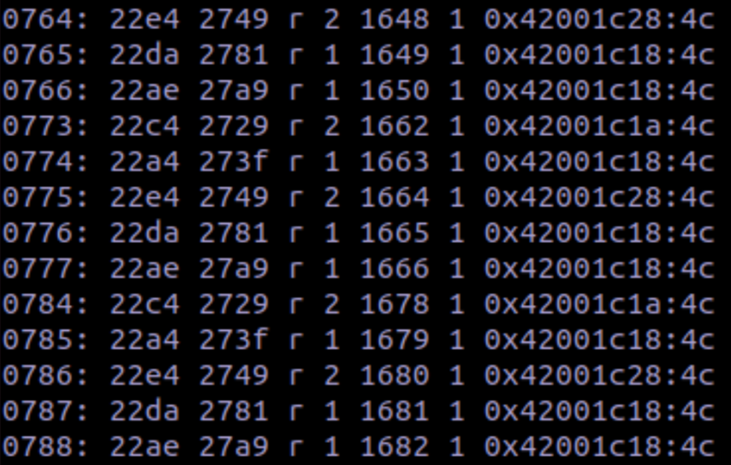
Using the second column, which is the program counter, we can use Ghidra to determine which
accesses are the serial read:
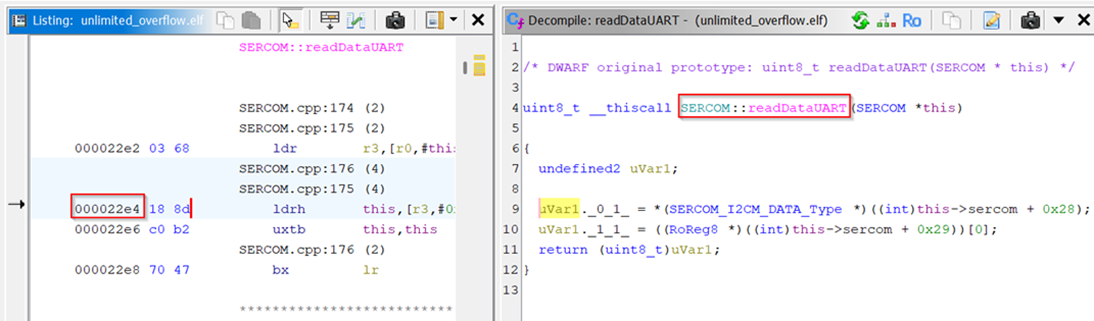
As shown above, the 22e4 instruction is the actual read operation. The other instructions are
checks for frame errors & to determine if there is any available data to read. Knowing this, we
can narrow down our list with grep again and store the list as a file named ‘offsets.txt’.
For the next step, I wrote a script that takes the offset column (access_fuzz_ind) and converts it
to hex.
convert.py
def convert_offsets_to_hex(input_file):
    with open(input_file, 'r') as file:
        lines = file.readlines()

    hex_offsets = []
    for line in lines:
        parts = line.split()
        if len(parts) >= 5:
            try:
                offset = int(parts[5])
                hex_offset = format(offset, 'x')
                hex_offsets.append(hex_offset)
            except ValueError:
                pass # Handle lines that don't have a proper offset value
    return hex_offsets

def main():
    input_file = 'offsets.txt' # Replace with your input file name
    hex_offsets = convert_offsets_to_hex(input_file)
    for hex_offset in hex_offsets:
        print(hex_offset)

if __name__ == "__main__":
    main()
The output of the script will be the hex offsets in the input file where the CPU made an MMIO
read for the serial input character that will be added to our buffer.
Now that we have all of the offsets, we can use the xxd tool to create a hex dump of the input
binary. I prefer to copy the original input file in case I need to look / revert back to the original
version.
cp <input file> patched_input
xxd patched_input > dump.hex
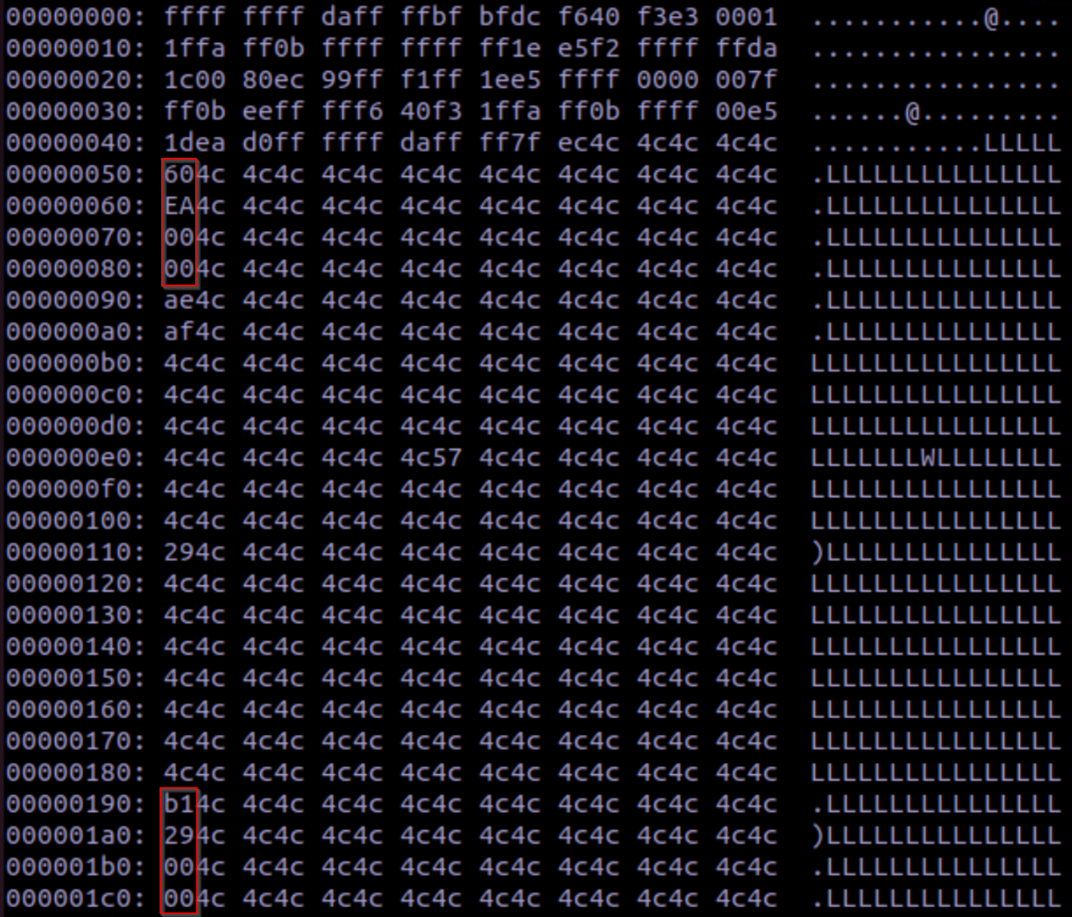
Utilizing a text editor, we can view the hex dump:
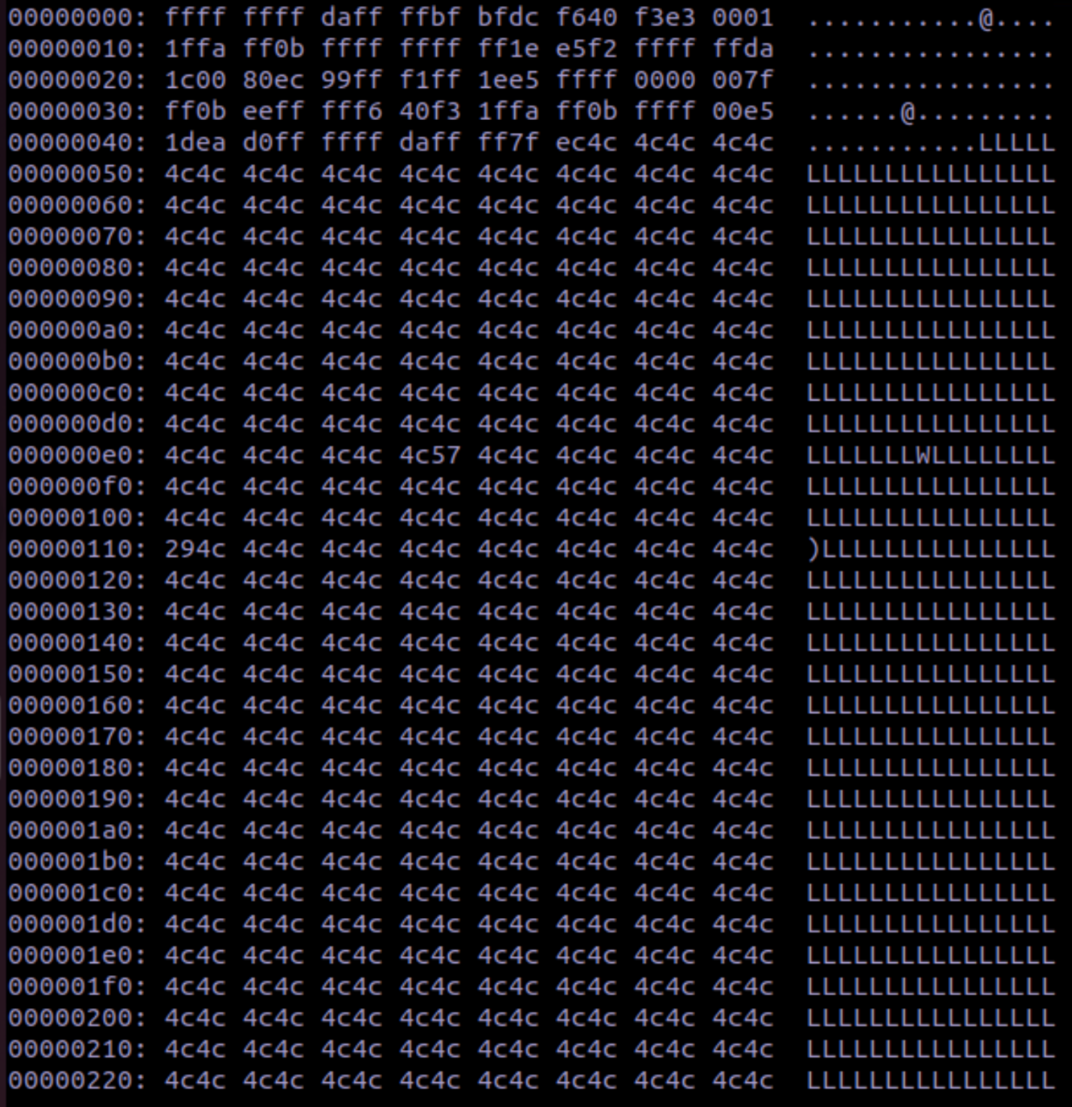
Using the hex output from the script above, we know that the first byte of offsets 50 - 100 are
where the CPU makes MMIO reads. We can edit these to ‘aa’ to demonstrate this:
Patch the binary with:
xxd -r dump.hex patched_input
and play the patched_input file with Fuzzware’s ‘replay’ tool.
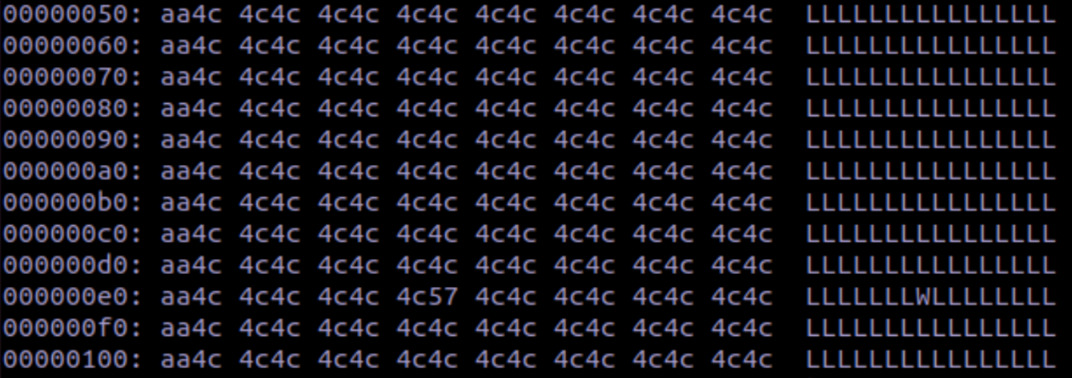
As the replay shows, our patched values are now in the registers and stack!
The program counter has also been subject to the buffer overflow:
Therefore, we should be able to patch the input binary to control what the firmware executes
after the loop function call returns.
EXECUTION FLOW INVESTIGATION
Since this is a bare-metal Arduino binary, it is a little more difficult to show impact. We don’t
have access to common system functions like libc to directly open a reverse shell. However,
since we control the program counter, we can execute any arbitrary function and control the
execution flow of the firmware.
We have access to USB and UART write functions, which could be used to prove impact, but
since we are emulating the binary with Unicorn and Fuzzware, it isn’t possible to actually receive
that serial output to show what happened. Instead, I decided to prove impact by redirecting the
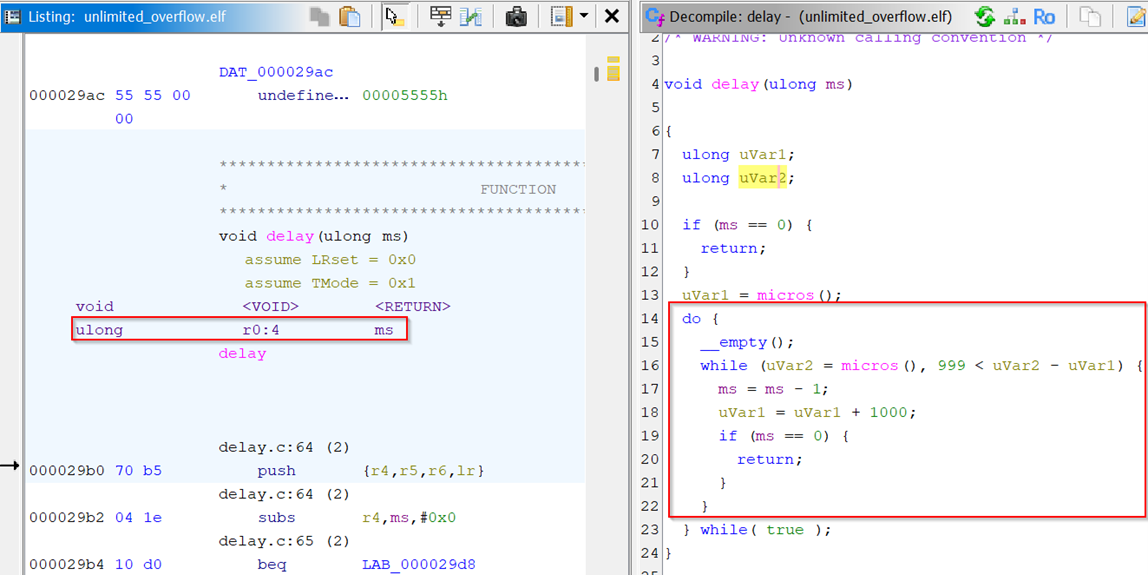
program to execute the “delay” function.
This function takes one argument, ‘ms’, in register 0. Then, it loops every millisecond until it
reaches that number. The impact of the stack overflow vulnerability can be demonstrated by
patching the binary to load register 0 with 0xEA60 (60000 milliseconds / 1 minute) and then
setting the program counter to the ‘delay’ function.
While the ‘delay’ function starts at 0x000029b0, we set the program counter to 0x000029b1
because Fuzzware/Unicorn emulates the binary in thumb mode, meaning the function addresses
have an odd offset rather than an even offset.
After patching the binary and placing a debug handler to print the arguments passed to the delay
function, we get this output:
This shows that the delay function is successfully being called with the argument we created!
Further output from Fuzzware shows that the delay function is called repeatedly until the
emulator crashes after running out of fuzzing input. In our case, we only delayed the program for
60 seconds (0x0000EA60) to demonstrate impact, but since the ‘delay’ function takes a 32-bit
ulong as it’s input, we could technically delay the program for up to 4294967295 (0xFFFFFFFF)
milliseconds, or a little under 50 days.
CONCLUSION
In conclusion, Fuzzware is able to:
- Find valid crashing inputs for a sample vulnerable firmware by fuzzing it’s MMIO memory space.
- Aid in determining the cause of the crash with the ‘fuzzware replay’ functionality.
- Output the MMIO access history for easier input patching.
- Re-emulate a patched input to show impact.
In the case of this firmware example, the stack-overflow vulnerability allowed an attacker to control the program counter, giving them the ability to alter the execution flow of the firmware. To demonstrate impact, I utilized the included ‘delay’ function to show that an attacker could utilize a stack overflow vulnerability to carry out a denial-of-service attack by delaying the program for up to 4294967295 (0xFFFFFFFF) milliseconds, or a little under 50 days.
SOURCES
https://www.usenix.org/system/files/sec22-scharnowski.pdf
https://github.com/fuzzware-fuzzer/fuzzware/blob/main/README.md
https://github.com/fuzzware-fuzzer/fuzzware/blob/main/docs/manipulating_inputs.md
Approved for public release. OTR 2025-00976.